How to Use Chronic Disease Data
On this page
Considerations for race and ethnicity data
Choosing crude vs. age-adjusted data
Considerations for trend data
Missing data
COVID-19 effects
Considerations for race and ethnicity data
When viewing and using data for racial and ethnic groups, keep three important ideas in mind:
Use of broad race groups – The datasets we use follow federal race and ethnicity categories, so the race and ethnicity categories included on the dashboard are broad. There are many communities within each race and ethnicity group. For example, Hispanic or Latino/a includes people of Mexican, Ecuadorian, Puerto Rican, and many other backgrounds. Health behaviors and patterns may look different for each community. It is important to know how these distinct communities compare to see if disease rates are different, but often we cannot share results for more specific communities because of how the data was collected. The data may not identify specific communities or the number of people within that community may be so small that we cannot share data and maintain privacy.
Use of varied data collection methods – Datasets use different methods to collect race and ethnicity data. For example, the Minnesota Behavioral Risk Factor Surveillance System survey has data reported by the person taking the survey. Data collection in clinics likely varies. In some cases, the person receiving care responds. In others, a health professional with varying input from the person receiving care may answer.
Potential choice of more than one race – It is important to allow people to choose multiple racial and ethnic categories to describe their identity. However, few datasets featured on the dashboard have adopted this practice yet.
We followed MDH best practices on using race and ethnicity data as much as possible.
Choosing crude versus age-adjusted data
You should use crude rates or percentages when you are interested in the overall burden of disease in the total population. Use age-adjusted rates or percentages when you want to understand differences between groups that are not due to one population being older or younger than the other. For example, you might want to know why two counties have different rates of disease. It is possible that one might have more older adults and, because the disease is more common among older adults, age explains the differences. You can use age-adjustment to remove (most of) the effects of age and see if factors other than age might be related to different rates.
For those who want to know details about how we age-adjusted, we used the 2000 U.S. population distribution as our standard population, in alignment with the National Center for Health Statistics.
Considerations for trend data
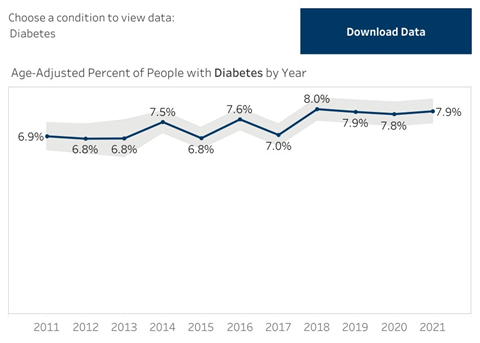
To look at trends in Minnesota, we need to consider that the overall population is getting older. So, we show trend data with age-adjusted rates to remove the effects of population aging over time. We need to dig a bit deeper into trend data to know what it means. The overall rate may look like it is increasing or decreasing over time, however, there may not be statistical evidence to say that this change is real. The grey shaded areas on the charts show the 95% confidence intervals, which represent the variation that can come from the way the data was collected. This information can help us decide if these estimates are meaningfully different from each other each year.
For example, the values in the chart below show a low of 6.8% and a high of 8.0%; however, the variation around the values is wide and even overlaps, which suggests that the numbers may not actually be as different as they appear.
Missing data
There is often some amount of missing or unknown data with any dataset. Missing values come from people responding “don’t know” or people simply not answering a question. These values are excluded from the analysis and not reported on the Dashboard. For most topics on the dashboard, the amount of missing data is 5% or less. More sensitive or personal information may have a higher rate of missing data. For example, nearly 20% of people did not provide information about their income on recent Behavioral Risk Factor Surveillance System surveys.
COVID-19 effects
The COVID-19 pandemic, which started in 2020, has had varying impacts on chronic disease data. Depending on the data source, data from 2020 and 2021 should be viewed with caution as they may not be representative of the years just before, the years just after, or the data trend. For example, hospitalizations and deaths due to some chronic conditions increased, while others decreased during surges of COVID-19 in the early months of the pandemic. Services such as cardiac rehabilitation were impacted by the closure of cardiac rehabilitation sites and patient concern about the safety of participating in center-based programs with other patients in close proximity.
Contact us
For more information, contact health.heart@state.mn.us.